

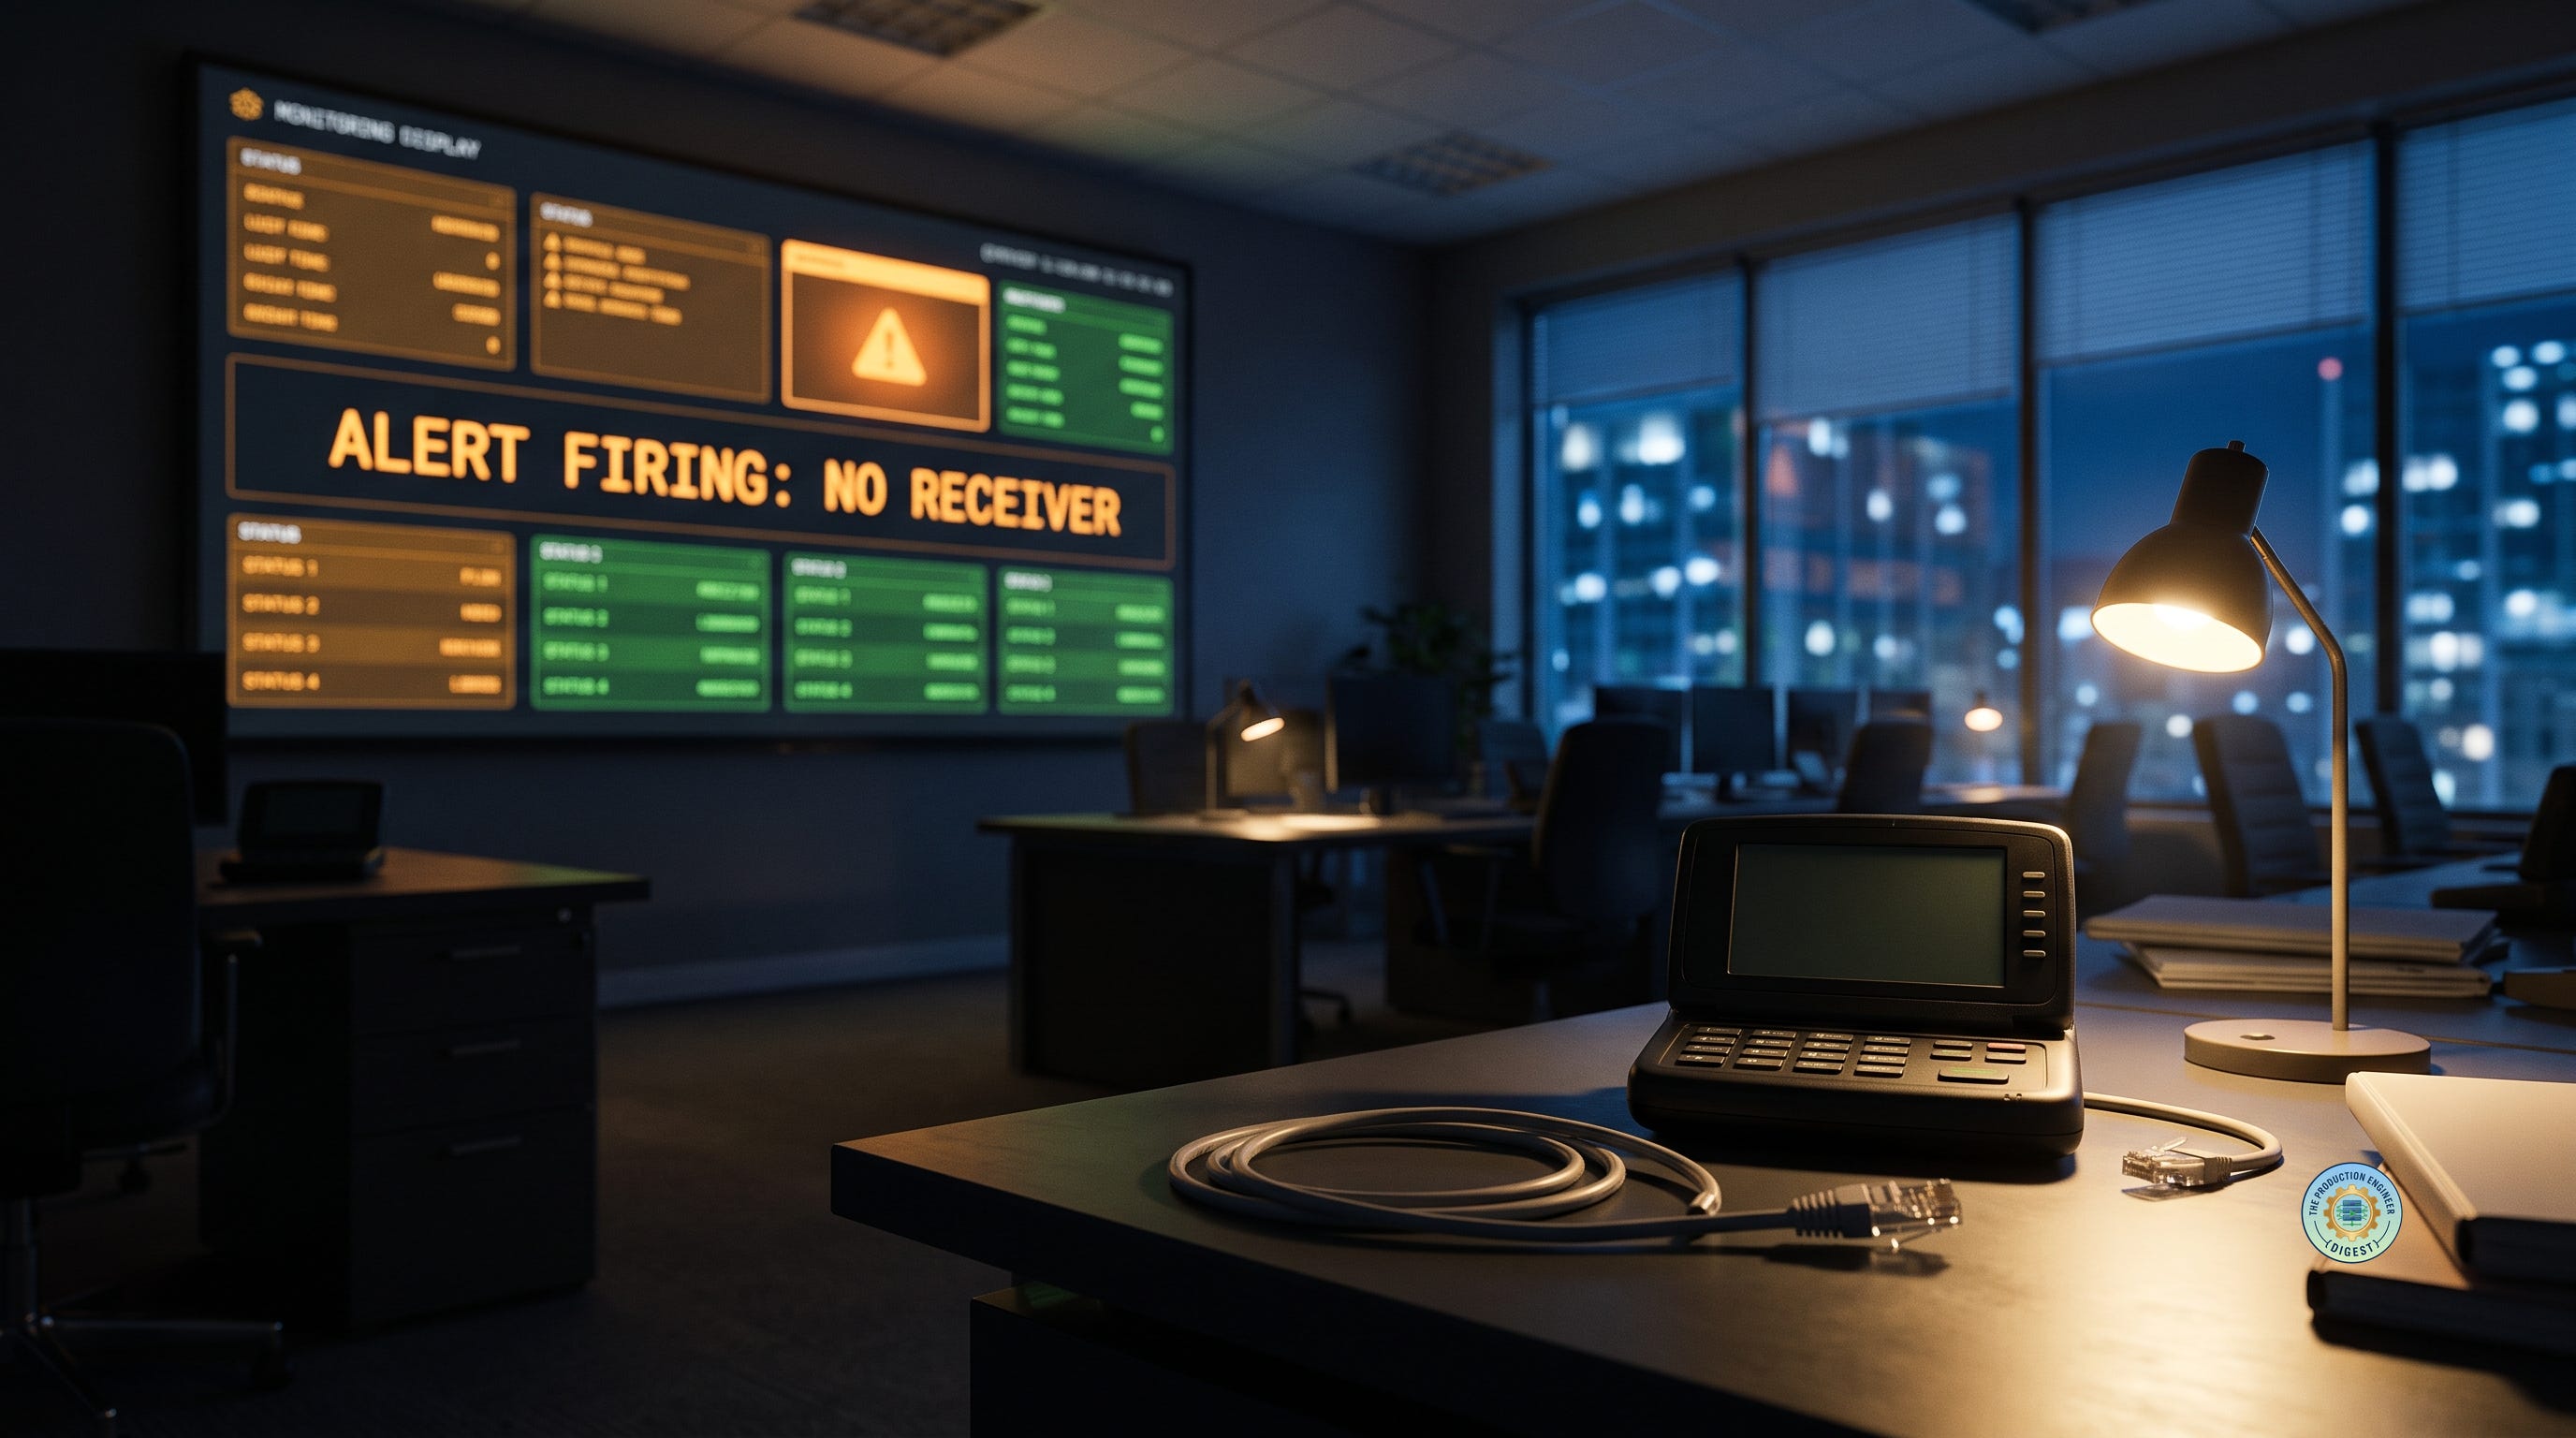
An alerting pipeline can fail silently, and when it does, the outage it was built to catch shows up with no page at all. Most post-incident reviews ask "did we have an alert for this?" The question I'd add is how you'd know if the alert fired and never reached a person.
Lucidworks' postmortem for a July certificate expiry is the clearest example I've read this year. On June 27, a synthetic test raised a 30-day warning that the certificate on its SaaS platform was about to expire. The warning went to an internal alert channel, where nobody acted on it. Then, from July 1, alerts stopped being delivered from the monitoring platform to the incident management system, so none of the follow-up notifications reached the team. The check ran and fired as designed for four more weeks. On July 27 at 17:56 UTC the certificate expired. Users got certificate errors for about 88 minutes, and Beacon signals sent during the window "were not ingested and are not recoverable."
The line in that writeup I keep coming back to is this one: "no monitoring existed on the alert pipeline itself." Most teams I've worked with could write the same sentence about themselves, including some with very good monitoring.
Silence Means Two Different Things
A quiet on-call shift has two explanations. Either nothing is wrong, or something is wrong and the news can't get to you. From where the pager sits, those look exactly the same. Zero pages on a Tuesday night feels like a good night, and nobody opens the alert router at 2 AM to check that it's still sending.
It's the blind spot from the hidden cost of green dashboards, one layer further down. A green dashboard can hide a failing service. A silent pager can hide a failing alerting system, and that one gets even less scrutiny, because the whole reason you have alerting is so you don't have to keep looking.
The Alerting Path Is a Production System
Write out every hop between "a metric crosses a threshold" and "a phone buzzes," and the list runs longer than most people expect:
the probe or collector that produces the signal
the rule evaluator: Prometheus, a vendor monitor, a synthetic check
the router, such as Alertmanager or a vendor's notification policy
the integration into the incident tool, usually a webhook URL or an API key
the service and escalation policy inside that tool
the on-call schedule that decides who is on right now
that person's notification settings, and the phone itself
Any of these can break without raising an error anyone sees. Someone rotates an integration key during a security cleanup, and the router starts getting 401s, logs them, and moves on. A service gets renamed in the incident tool while the routing rule still points at the old name. A schedule has a two-hour hole at a timezone handoff. An engineer gets a new phone and never re-enables push notifications. Nothing upstream notices, because everything upstream is still working.
Lucidworks' break was at the fourth hop, between the monitoring platform and incident management. Every hop before it kept doing its job, which is why nothing looked wrong. The checks ran, the dashboards were up, and the warnings kept firing into a pipe that went nowhere.
Request-path services get SLOs, runbooks and named owners. The alerting path usually gets none of those, even though it's what you're relying on at the exact moment everything else has failed.
When the Outage Takes the Pager Down With It
The other way to lose alerting is shared fate, where the failure that breaks production also breaks the path that would have told you about it.
Slack's January 4, 2021 outage is the standard example. Early in the investigation, in Slack's words, "our dashboarding and alerting service became unavailable." Those services ran in a different VPC from their own backend databases, so reaching their data meant crossing the same AWS Transit Gateways that were overloaded and causing the outage. Engineers fell back to internal consoles, command-line tools and querying the metrics backends by hand. The page that kicked off the response came from "an external monitoring service," one that didn't share the broken network.
Pico.sh's May 2024 postmortem is smaller, and almost funny. A VM ran out of memory at 11:02 AM and took four services down with it. Prometheus "did receive alerts about the service outage," and sent them to an IRC channel. Phone notifications from that channel came through an IRC bouncer, and the bouncer was one of the four services on the dead VM. So the alerts went to a channel nobody was connected to. The team found out at 12:19, 77 minutes in, and that's 77 minutes before anyone could even start the diagnosis work I wrote about in where incident time actually goes.
Both are the failure-domain mismatch from Roundup #3, applied to the alerting stack instead of the service. If whatever pages you shares a network, a VM, a region or an identity provider with what it watches, you have a fire alarm wired to the circuit most likely to burn.
Delivered to a Channel Isn't Received
Lucidworks had a second, quieter failure, and it came before the pipeline broke. The June 27 warning was delivered. It landed in an internal alert channel and sat there.
Most teams have a channel like that, where bots post into a scroll of messages that people mute after the first week. A 30-day certificate warning doesn't need to wake anyone up. It does need an owner and a deadline: a ticket assigned to a team, due well before expiry, that escalates if it's still open. That's the direction Lucidworks took. Certificate alerts now go to "a paged alerting path that requires acknowledgment," and certificate rotation is being automated so the alert should rarely need to fire.
The test I'd apply to any warning with a long lead time: if it can only land in a channel, plan on it being missed.
A Heartbeat for the Pager
The usual fix for silent pipeline failure flips the logic around. Send a signal that should always arrive, and raise the alarm when it stops.
The Prometheus ecosystem has this built in. kube-prometheus ships an alert called Watchdog whose rule is just vector(1), which means it is always firing. Its runbook states the purpose plainly: it is "meant to ensure that the entire alerting pipeline is functional." You route Watchdog to an external dead man's switch service that expects to hear from it every few minutes. When the heartbeat stops, whether because Alertmanager crashed, a credential expired or someone changed a firewall rule, that outside service pages you over a separate path.
Two details decide whether this protects you or only looks like it does. First, the receiver has to sit outside the failure domain of everything it watches: another provider, and ideally another network. Second, the heartbeat should pass through as many real hops as you can manage. If it goes from Alertmanager straight to the dead man's switch, it proves Alertmanager is running and tells you nothing about the integration into your incident tool. Lucidworks' failure sat downstream of the point where a lot of Watchdog setups stop.
Test the Last Mile With a Real Page
Heartbeats cover the machinery. They don't cover the last few hops: the schedule, the person's notification rules, the phone left on Do Not Disturb.
The cheapest check I know of is to send one real test page through the production integration at every on-call handoff, to whoever is coming on, and have them acknowledge it. It takes half a minute. It catches the expired key, the renamed service, the schedule gap and the new phone all at once, at 10 AM on a Monday rather than 3 AM in the middle of an outage.
Add at least one black-box probe that runs from outside your infrastructure and pages through its own route, the way Slack's external monitor did. When your internal stack goes down with production, that's the page that still gets through.
Questions for Your Next Alert Review
Next time a postmortem says "the alert didn't fire," or the worse version, "it fired and nobody saw it," these are worth asking:
What tells us when the alerting pipeline itself has stopped, and where does that signal go?
Does anything in our paging path share a network, VM, region or identity provider with the systems it monitors?
Which alerts only ever land in a channel, and who owns each one?
When did someone last get a real page end to end, rather than a test notification sent from inside the tool?
Which integration keys does our alert routing depend on, and what happens to paging the day one of them is rotated?
Lucidworks' check did its job for 30 days straight. The part that failed was the part nobody checked, because it had always worked before. If your pager has been quiet for a long stretch, it's worth sending yourself a page to make sure it still works.