

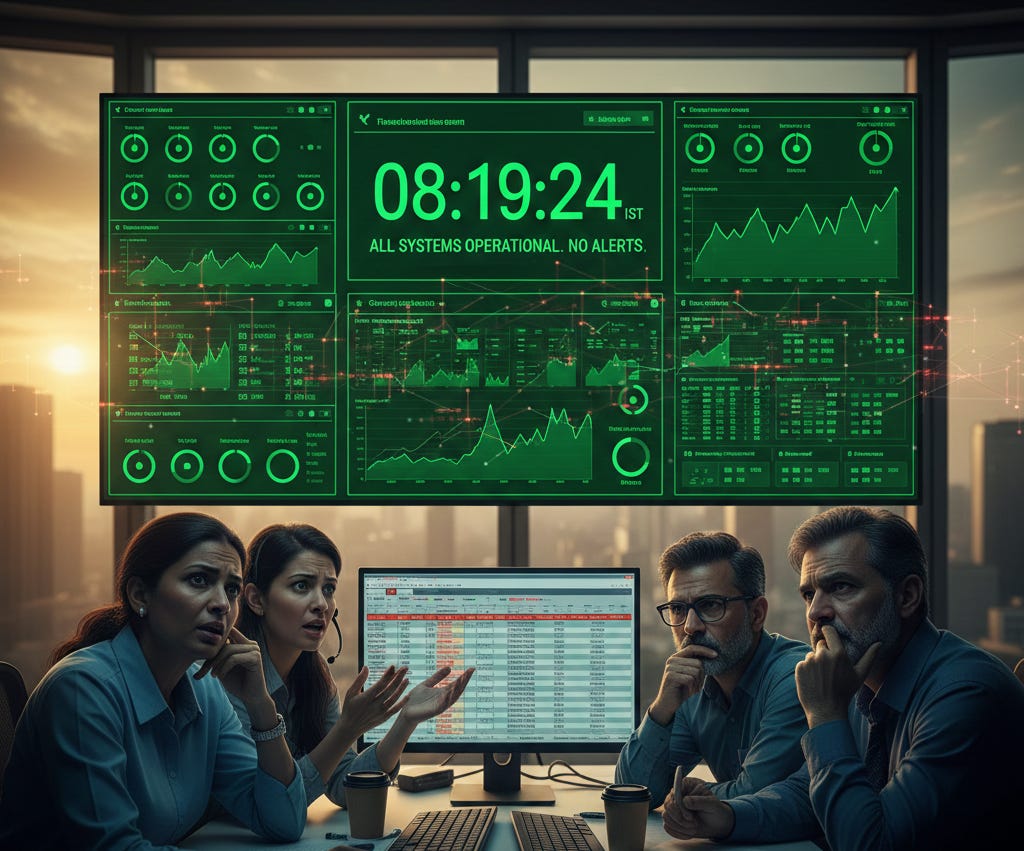
Dashboards are green.
Jobs are marked successful.
No alert has fired.
And yet, the call comes in.
Trades are missing.
Numbers don’t reconcile.
Downstream teams noticed it first.
If you’ve worked in banking production support long enough, this sequence isn’t surprising. It’s expected.
This isn’t a failure of monitoring tools.
It’s a failure of what we’ve decided to monitor.
Green Does Not Mean Correct
Most dashboards in banks answer one question very well:
“Is the system up?”
But banking incidents rarely start with systems going down.
They start with systems doing the wrong thing quietly.
Messages flow — but partially.
Jobs complete — but produce incorrect output.
APIs return success — with bad payloads.
Reconciliation breaks hours later, after market impact has already occurred.
Nothing breached a threshold, because nothing technical was broken.
What Dashboards Are Actually Optimized For
This part is uncomfortable, but important.
Most production dashboards in banks are optimized for:
SLA reporting
audit comfort
noise suppression
management visibility
They are excellent at answering:
“Did anything crash?”
“Are we compliant?”
“Can we explain this in a review?”
They are far worse at answering:
“Is the business outcome correct?”
“Did every expected event actually happen?”
“What could be silently wrong right now?”
This isn’t accidental. It’s structural.
The Incidents Green Dashboards Don’t See
Some of the most serious banking incidents don’t look like incidents at first.
They look like:
trades booked upstream but not propagated downstream
queues draining normally while edge cases are dropped
vendor feeds delayed just enough to miss cutoffs
end-of-day jobs marked successful with incomplete data
From a dashboard perspective: all green.
From a business perspective: latent risk.
By the time alerts fire — if they ever do — the damage is already done.
The Hidden Cost Paid by Production Support
When dashboards don’t capture risk, people absorb it.
Senior production support engineers become:
anomaly detectors
pattern recognizers
living incident histories
During market hours, real monitoring looks like:
manual sanity checks
expected vs actual counts
quiet questions like “does this feel low?”
experience built from past failures
None of this appears on dashboards.
None of this is visible in KPIs.
Yet this human layer is what prevents many silent failures from becoming public ones.
Why This Keeps Repeating
Post-incident reviews usually focus on:
tighter thresholds
faster alerts
more dashboards
Rarely do they ask:
Which business invariant went unmonitored?
What signal did a human catch before the system did?
Why were we blind to this class of failure?
So the same incidents return — slightly modified, slightly renamed, but fundamentally unchanged.
What Actually Improves Signal (Without New Tools)
This isn’t about buying better monitoring.
What helps is changing what you consider observable:
Expected vs actual flows
Not just “did the job run,” but “did it produce what the business expects?”Absence-of-event alerts
Silence can be more dangerous than noise.Business invariants
Counts, balances, reconciliation deltas — not just CPU and latency.Market-hour thinking
Risk behaves differently when money is moving.
These ideas aren’t new. They’re just harder to operationalize — and harder to summarize in status decks.
The Real Role of Production Support in Banks
Production support is often described as reactive.
In reality, it’s the last line of defense against:
financial risk
regulatory exposure
reputational damage
When dashboards are green, production support is often the only function asking:
“Are we sure this is correct?”
That question doesn’t show up in SLAs.
But it’s what keeps systems honest.
Final Thought
If your dashboards are always green, it doesn’t mean your systems are healthy.
It usually means:
risk has been pushed downstream
detection has been delegated to humans
experience is compensating for blind spots
The question isn’t whether dashboards work.
It’s who carries the risk when they don’t.