

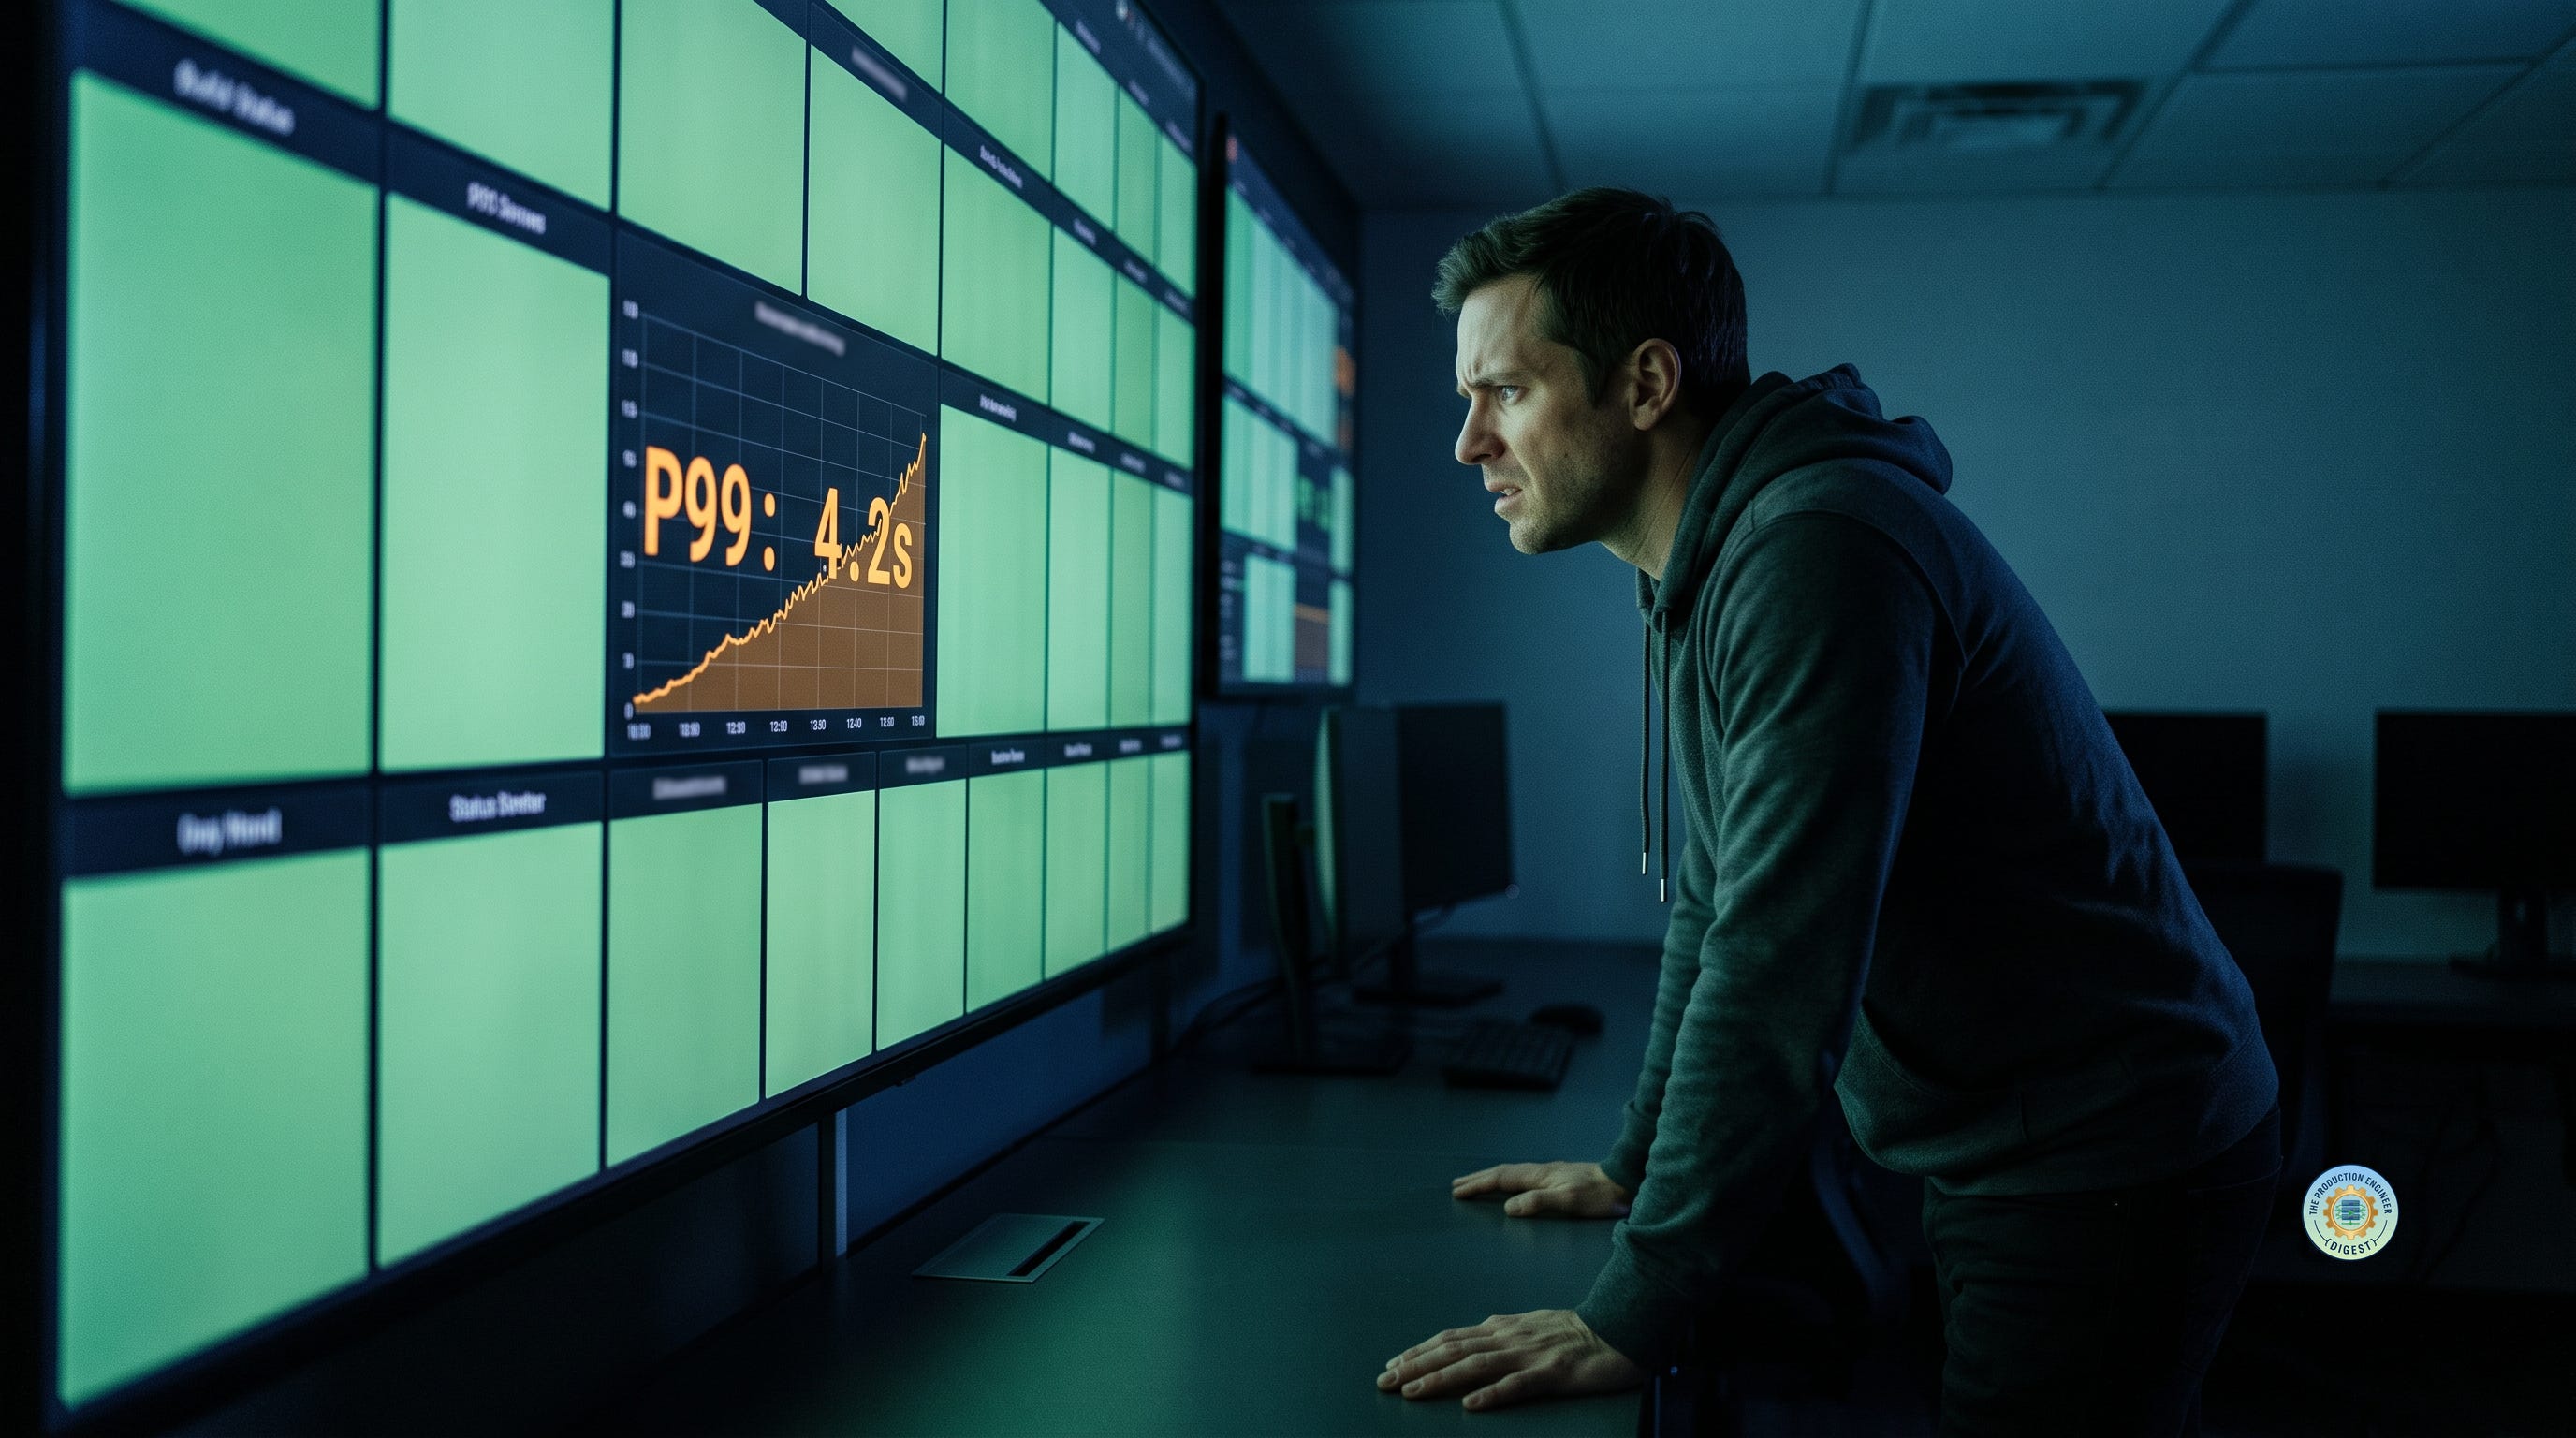
Performance degradation — the slow, creeping kind that never crosses a hard failure threshold — is now rated by most reliability teams as just as damaging as an outright outage. The problem is that almost nothing in a typical alerting stack is built to notice it happening. Your status page can stay green for hours while a checkout button quietly goes from four hundred milliseconds to four seconds, no pages fire, no one's phone buzzes, and your users start rage-clicking anyway.
The Alert That Never Escalates
On July 16, 2026, Inngest's state store proxy started failing to come back up cleanly after a routine restart. Customers began seeing increased execution latency and elevated execution errors at 09:32 UTC. Checkpointing broke, and SDKs silently fell back to a slower async response path to compensate — which is exactly the kind of self-healing behavior that makes a bad situation look survivable on a dashboard.
An alert did fire, at 09:35 UTC — three minutes after impact began. It just wasn't the alert that mattered. Because the signal was classified as medium priority, it didn't trigger immediate on-call escalation. The degradation ran for 168 minutes before it was fully resolved at 12:20 UTC, and Inngest's own writeup names the real gap plainly: the alerting had a severity level for "something is wrong" but not one calibrated for "something is wrong and getting worse, continuously, for the next two and a half hours."
That's not a monitoring gap. Inngest had a metric, a threshold, and an alert. It's a taxonomy gap — the alerting hierarchy had no tier between "fine" and "down" that matched what was actually happening.
Why Binary Alerting Can't See This
Most paging systems are built around a small set of binary questions: is the process up, is the error rate above a threshold, did a health check fail. Those questions have clean yes/no answers, which is exactly why they're easy to alert on. Latency creep doesn't have a clean answer. A P99 that drifts from 300ms to 3 seconds over ninety minutes never technically crosses "down," and most static thresholds are set wide enough to avoid noisy false pages, which means they're also wide enough to absorb a slow bleed without ever tripping.
We've written before about how four different monitoring tools can each show a technically true, mutually contradictory picture of the same incident — one tool showing current state as healthy while another's time-series view already shows the trend breaking. The degradation problem is a sharper version of the same disease: it's not that the tools disagree, it's that the alerting layer sitting on top of all of them was designed to answer "is it broken" when the real question, most of the time, is "is it getting worse."
The Industry Already Knows This, On Paper
This isn't a fringe complaint. LogicMonitor's SRE Report 2026, based on 418 responses from reliability engineering professionals surveyed in mid-2025, found that nearly two-thirds of respondents — 67% — now say performance degradations are as serious as outages. That's a real, fairly recent consensus shift; "slow is the new down" has become close to a stock phrase in the field this year.
But the same report surfaces the gap underneath the agreement: only 26% of organizations consistently measure whether performance improvements actually affect business outcomes like revenue or NPS. Teams believe degradation matters. Far fewer have built the instrumentation, or the alerting tiers, that would let them act on that belief before a customer notices first. Believing something is serious and having a system that pages you when it happens are two different investments, and most organizations have only made the first one.
When the Outage Ends but the Degradation Doesn't
Railway's July 2, 2026 incident is a useful case because it shows both failure modes stacked on top of each other, with a clean handoff between them. An upstream ISP degradation caused packet loss across US regions starting at 07:44 UTC. At 08:39, engineers disconnected from a secondary carrier without first verifying routing stability, which briefly left the zone with no stable route to the internet — a real, unambiguous outage, about twenty minutes long.
Routing was reconnected and stabilized by 08:59. If your dashboard only tracked "is there a route to the internet," the incident looked over. It wasn't. Storage connections had quietly gotten stuck on a slow management network during the instability and held onto that bad path silently even after the primary failure cleared. I/O wait stayed pinned at 58% — down from nowhere, since routing was "healthy" — for another two hours, until the root cause was identified at 10:45 UTC and I/O wait finally dropped back under 5% by 11:04. Private networking, affecting roughly 20,000 host-to-host links, didn't fully recover until 11:49.
The hard outage was twenty minutes. The part that actually cost the most engineering time to find and fix was the two hours after it, where nothing was "down" by any binary definition and everything was still broken. This is the same shape as the untested-safeguard pattern we covered in a recent roundup — a system quietly holding a bad state that looks fine from the outside because no one built a check for exactly that condition.
What Actually Needs to Change
None of this requires exotic tooling. It requires treating degradation as its own alerting category instead of a lesser version of an outage:
Add a real severity tier for sustained degradation, distinct from both "informational" and "critical outage," with its own escalation path — not a medium-priority bucket that quietly doesn't page anyone.
Alert on duration and trend, not just threshold. A P99 that's elevated for two minutes and one that's elevated for two hours are different incidents; most alerting configs treat them identically.
Put SLOs on the tail latency percentiles customers actually feel (P95/P99), not just uptime and error rate — uptime can look perfect while the experience underneath it quietly erodes.
Check whether a "healthy" state is actually load-bearing, the way Railway's routing check was healthy while storage was still stuck. A recovered top-level signal doesn't guarantee every dependency underneath it recovered too.
This is the same structural lesson as why routine changes keep causing the worst outages: a process built to review intent — "is this threshold set," "is this change approved" — misses the failures that live in execution detail. An alerting hierarchy built to answer "up or down" misses the failures that live in the slope of a graph.
Reliability teams have already agreed, on paper, that slow is the new down. The next step is making sure something on your team's phone agrees too.