

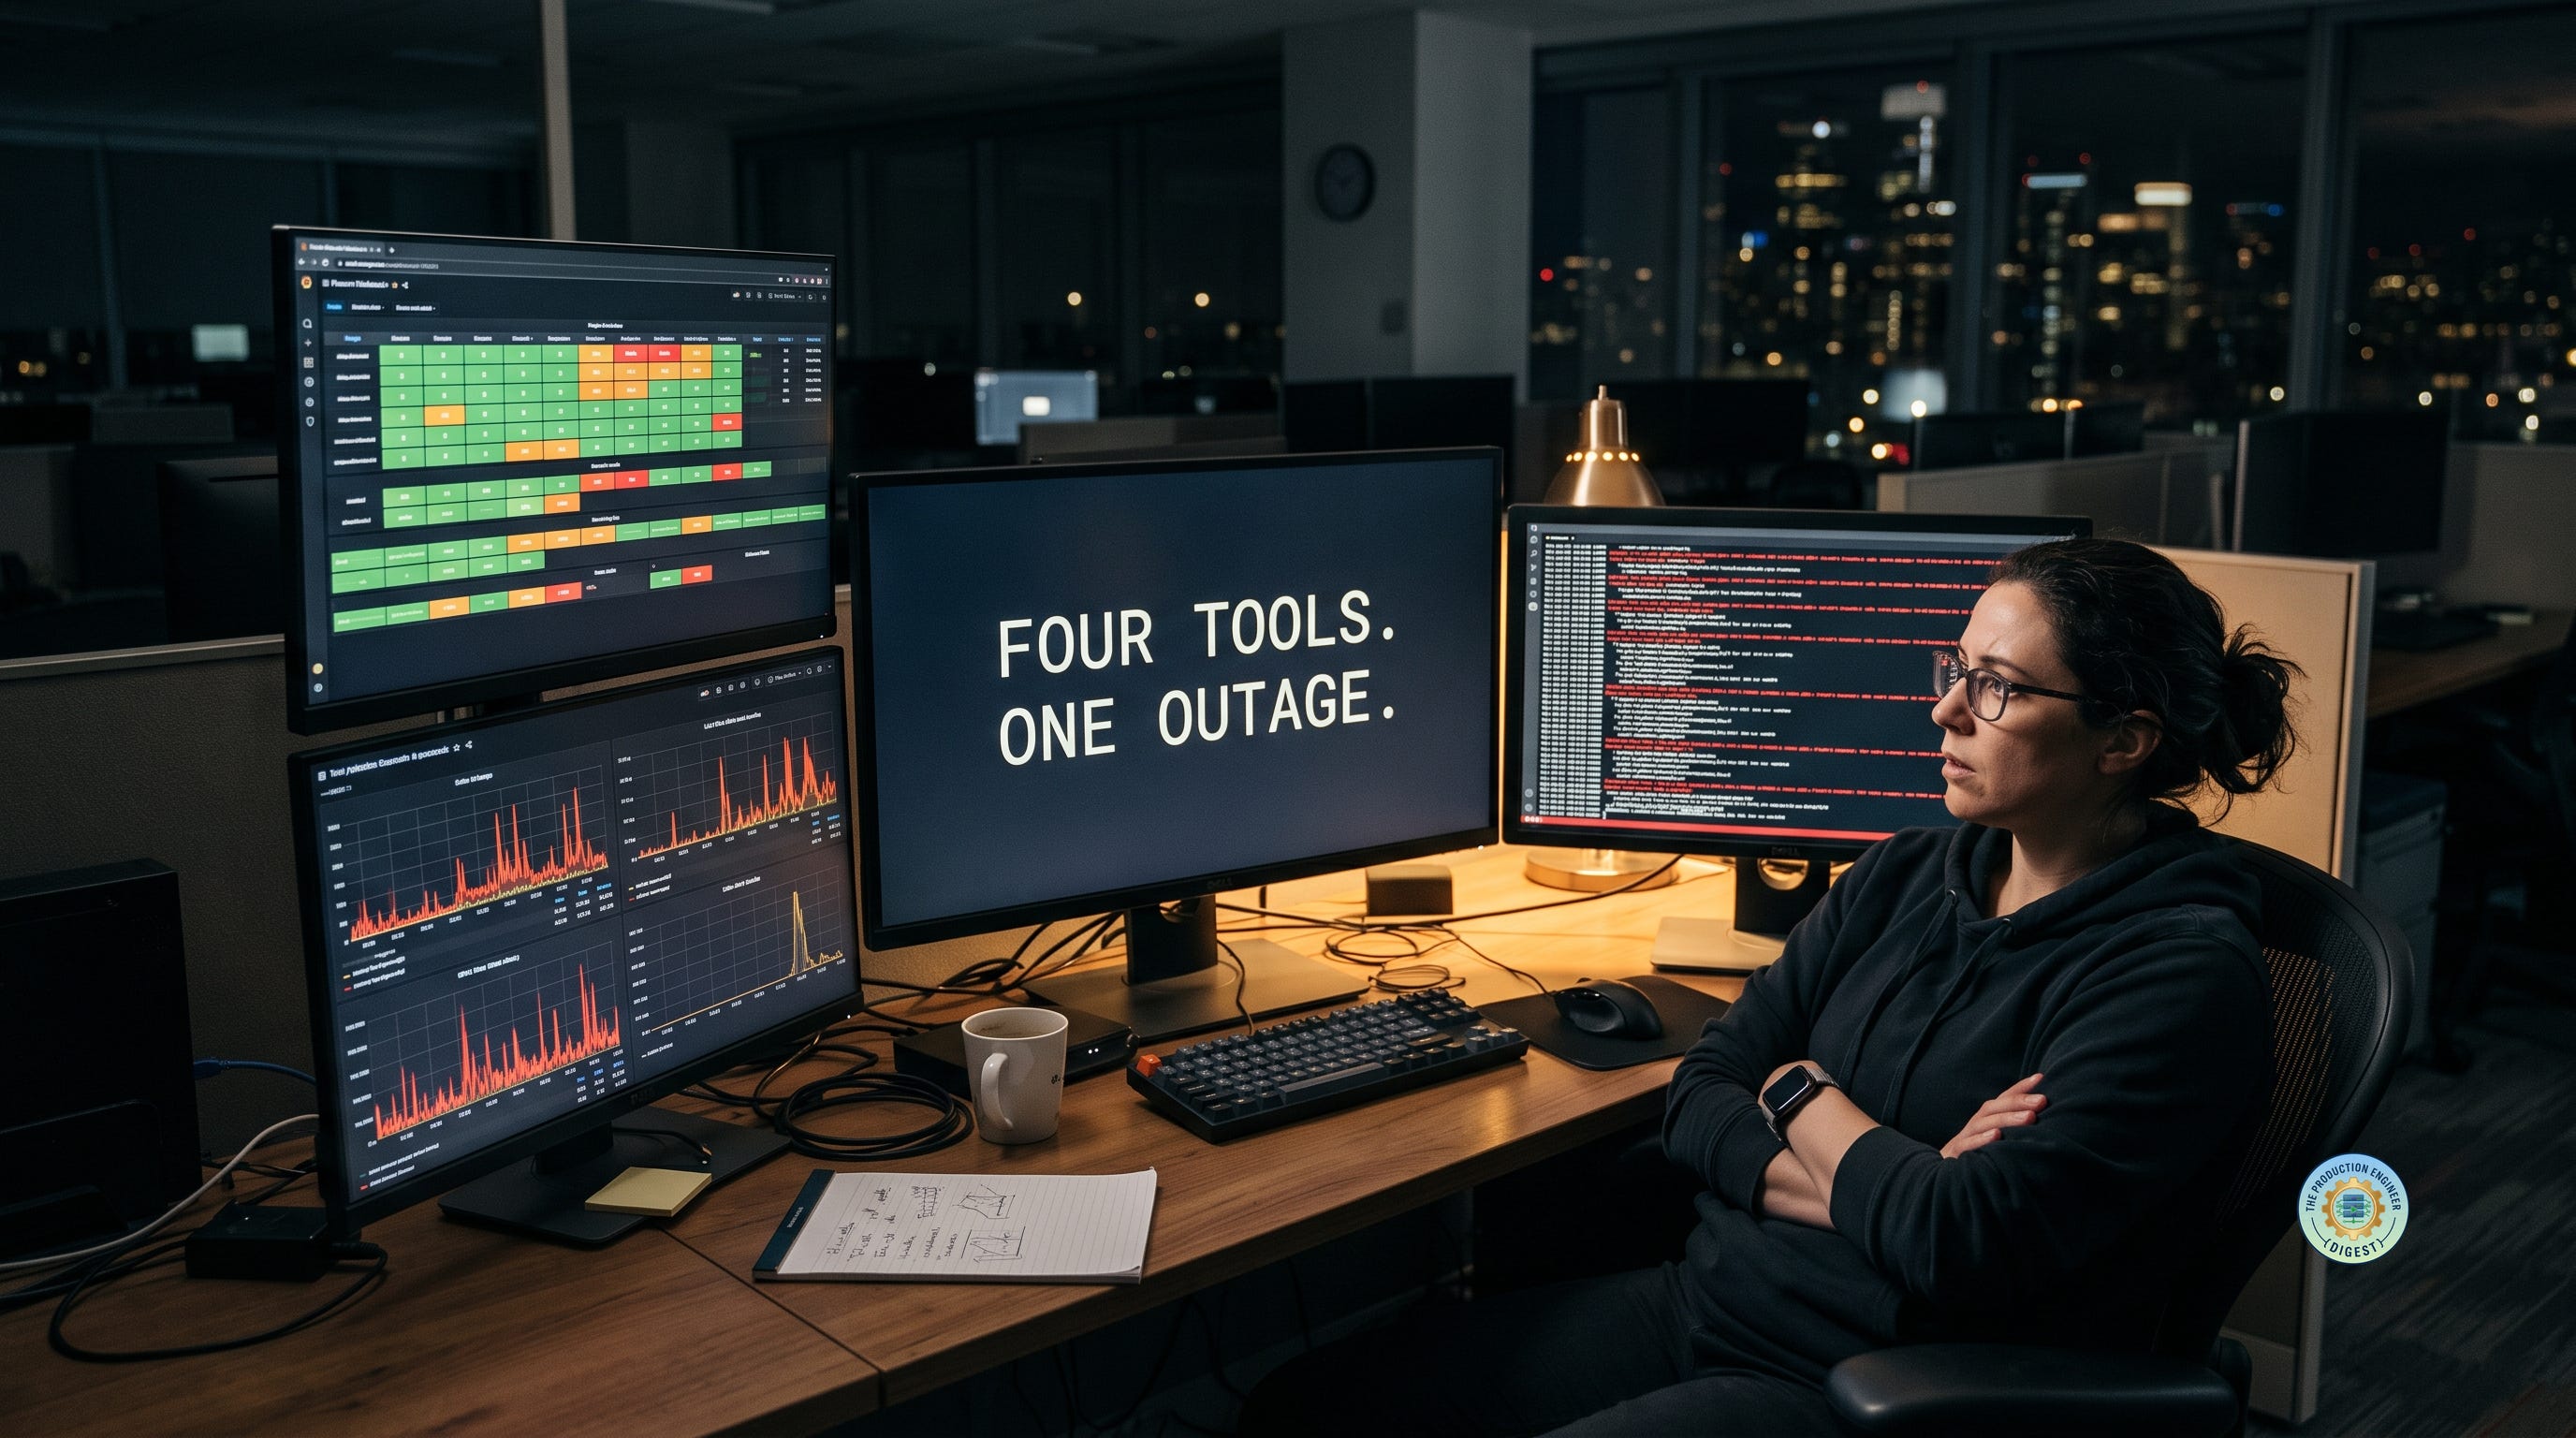
Open your laptop during a Sev-1 and count the tabs. Geneos on one screen, a Grafana dashboard on another, a Splunk search spinning in a third, and the incident Slack channel filling up faster than you can read it. Each one is telling you something true about the same outage. None of them is telling you the whole thing — and none of them agrees with the others on what time it is, what the service is called, or whether the problem is still happening.
The first twenty minutes of a lot of incidents isn't diagnosis. It's reconciliation: stitching four partial accounts into one story. That work is invisible in every postmortem, and it's a large part of why mean time to resolution stays stubbornly flat even as the tooling gets better.
Each Tool Encodes a Theory of What Monitoring Is
Every monitoring tool was built by people trying to answer one question well. That founding question never fully goes away. It shapes what the tool makes easy, what it makes hard, and what it quietly can't do at all. Run four of them and you're running four theories of what "monitoring" means — and in the middle of an incident, you're the one holding them together.
Geneos: The Present Tense
ITRS Geneos has been the default real-time monitoring layer on a lot of trading floors and banking operations teams for years, and it's built around one question: what is the state of the estate right now? Netprobes on each host sample metrics, a Gateway runs rules against those samples and assigns a severity, and the console shows you a wall of cells that are green, amber, or red this second. ITRS's own docs put the design goal plainly — "Gateways provide configuration for and gather data asynchronously from one or more Netprobes. These collected data are analyzed in real-time" (ITRS).
That focus is a strength and a blind spot. Geneos is excellent at "this specific process has a queue backing up, now." It's weak at "when did this start" and "what did it look like an hour ago," because deep history isn't the point — the dataviews are a live readout, not an archive. A cell that's red now tells you nothing about whether it was red, flapping, or fine ten minutes ago, unless someone happened to be watching it then.
Grafana: The Shape of Time
Grafana starts from the opposite instinct. Its native question is "how has this number moved?" — it renders time-series data from Prometheus, Graphite, InfluxDB and the rest into dashboards built to show change over a window. It's a serious platform now, not just a charting layer: "Grafana Labs is a Leader in the 2026 Gartner® Magic Quadrant™ for Observability Platforms" (Grafana).
On a Grafana panel you can see that latency started climbing at 09:14, plateaued, then stepped up again at 09:30 — the exact shape that tells you whether you're chasing one cause or two. What Grafana won't tell you is why. The panel shows p99 tripled; it doesn't show the stack trace, the failing downstream, or the one customer sending malformed requests. And a dashboard is only as good as the question its author anticipated six months ago — a green dashboard doesn't mean the system is correct.
Splunk: The Evidence Room
Splunk is where you go when you need to know what actually happened to a specific request. It indexes the logs and lets you interrogate them; SPL, its query language, is closer to forensics than to monitoring. Ask it "every 5xx from this service between 14:00 and 14:20, grouped by upstream" and it will tell you — if you can write the query, and if the fields you need were extracted the way you expect.
The cost is speed, in two senses. Splunk's "billing is primarily based on data ingest volume, which can lead to high and unpredictable costs as telemetry grows" (Grafana), so teams under budget pressure log less than they'd like, and the line you need may simply not be there. And a broad search over a bad twenty minutes can take minutes to return while the bridge call waits on you. Splunk has the answer more often than the other three — it's just the slowest to give it up, exactly when you have the least patience for waiting.
Slack: Where the Humans Are
The fourth tool isn't a monitoring tool at all, but it's where the incident actually lives. Slack is where someone says "I think it's the payments deploy from 13:50," where the incident commander assigns roles, and where the real timeline gets written in fragments between "can someone check the DB" and "wait, who owns this service now?"
Slack's blind spot is that it's lossy and ephemeral. The channel holds the richest account of the incident — live hypotheses, ruled-out theories, the exact moment someone spotted the cause — and it's also the least structured, the hardest to search a month later, and gone from everyone's attention the second the channel goes quiet. Half the work of a good postmortem is just transcribing what the channel already knew. Postmortems without teeth often begin as incidents whose Slack history was never turned into anything durable.
One Incident, Four Tools
Here's the same twenty minutes seen four ways. Geneos goes amber on a payment-gateway process: the outbound-queue-depth rule has tripped, and the number is climbing. That's all Geneos will give you — it's bad now, it's getting worse. You open Grafana for the shape: the queue was flat until 15:12, when it began a clean linear climb, no step, no plateau. One cause, started at 15:12. Now you need the why, so you search the gateway logs in Splunk around that minute — connection timeouts to a downstream fraud-scoring service, the first at 15:11:44. Meanwhile the Slack channel has already moved on: someone from the fraud team posted at 15:16 that they'd pushed a config change at 15:10 and were rolling it back.
Four tools, and the whole story only exists across all of them: what (Geneos), when and what shape (Grafana), why (Splunk), who and what next (Slack). Miss one and you're guessing. The skill isn't mastering a single tool — it's knowing which one to reach for at each step, and carrying a timestamp from one to the next without fumbling the timezone.
The Gap Between the Tools Is Where Incidents Hide
Four tools, four honest partial views. The damage is in the seams.
No shared clock. Geneos shows one timezone, Grafana defaults to UTC, Splunk shows whatever the indexer stamped, and Slack renders timestamps in each reader's own zone. Reconstructing "what happened first" turns into timezone arithmetic under pressure — a reliable way to pin an outage on the wrong change.
No shared vocabulary. The service is `pmt-gw` in Geneos, `payments-gateway` in Grafana, and `PaymentGateway` in the logs. Nothing joins those automatically; you do it in your head.
No shared link. You can't hand a colleague "the thing I'm looking at right now." You send a screenshot, and they go hunting for it again in their own copy of the tool.
Each seam is a small tax. Together they're why a five-person incident call spends its opening stretch just agreeing on what's true. The "the safeguard was the problem" pattern from the last Roundup is easier to fall into when your four sources of truth are quietly disagreeing with each other.
What Actually Helps
"Single pane of glass" is the vendor answer, and it mostly doesn't arrive — you'll have these four tools, or their direct replacements, for years. The realistic fixes are cheaper than a migration.
Standardize the clock. Every dashboard, every log timestamp, every incident channel: UTC, everywhere, no exceptions. It's a one-time configuration pass that deletes an entire category of mistake.
Standardize the name. Pick one canonical service identifier and make every tool carry it — a Geneos managed-entity attribute, a Grafana template variable, a Splunk indexed field. Then a search in one tool is a search in all of them.
Make the incident channel the system of record. Not Geneos, not Grafana — the one place that captures human reasoning. Paste links, values, and screenshots into it as you go, so the timeline assembles itself and the postmortem becomes transcription instead of archaeology.
Learn each tool's blind spot before 2 a.m. Geneos has no memory. Grafana has no "why." Splunk is slow and possibly incomplete. Slack is lossy. If you know which question a tool can't answer, you stop burning minutes asking it.
None of this is a tooling project. It's a handful of conventions, agreed once and enforced in config. As the AI SRE agents piece noted, the automated investigators arriving now are good at correlating across exactly these sources — but they need the same things a human does: a shared clock and a shared name. Fixing the seams helps you either way.
The teams that debug fastest aren't the ones with the best single tool. They're the ones who've accepted they have four, learned what each is for, and spent the small effort to make the four line up — so the first twenty minutes of the next incident goes to solving it, not translating it.